Direkt zum Inhalt

Wie ändere ich die Formfarbe basierend auf dem Zellenwert in Excel?

Das Ändern der Formfarbe basierend auf einem bestimmten Zellenwert kann eine interessante Aufgabe in Excel sein. Wenn beispielsweise der Zellenwert in A1 kleiner als 100 ist, ist die Formfarbe rot, wenn A1 größer als 100 und kleiner als 200 ist Die Formfarbe ist gelb, und wenn A1 größer als 200 ist, ist die Formfarbe grün, wie im folgenden Screenshot gezeigt. Um die Farbe der Form basierend auf einem Zellenwert zu ändern, wird in diesem Artikel eine Methode für Sie vorgestellt.

doc Form ändern Farbe 1

Ändern Sie die Formfarbe basierend auf dem Zellenwert mit VBA-Code


Pfeil blau rechte Blase Ändern Sie die Formfarbe basierend auf dem Zellenwert mit VBA-Code

Der folgende VBA-Code kann Ihnen dabei helfen, die Formfarbe basierend auf einem Zellenwert zu ändern. Gehen Sie dazu wie folgt vor:

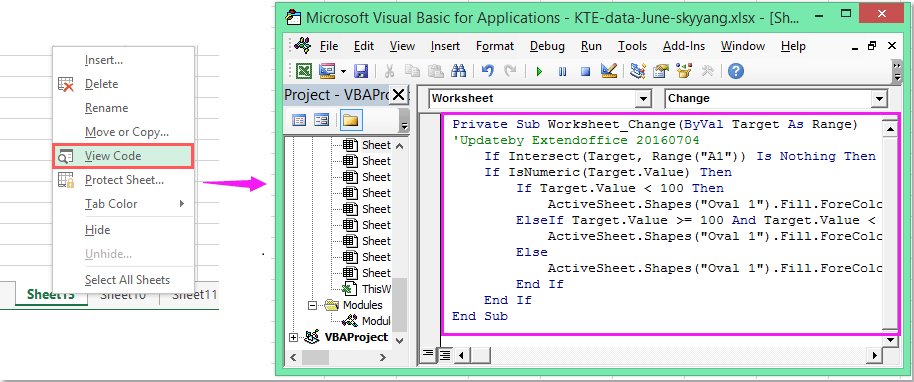
1. Klicken Sie mit der rechten Maustaste auf die Registerkarte Blatt, auf der Sie die Formfarbe ändern möchten, und wählen Sie dann aus Code anzeigen aus dem Kontextmenü in der herausgesprungenen Microsoft Visual Basic für Applikationen Fenster, bitte kopieren Sie den folgenden Code und fügen Sie ihn in das Feld ein Modul Fenster.

VBA-Code: Ändern Sie die Formfarbe basierend auf dem Zellenwert:

Private Sub Worksheet_Change(ByVal Target As Range)
'Updateby Extendoffice 20160704
    If Intersect(Target, Range("A1")) Is Nothing Then Exit Sub
    If IsNumeric(Target.Value) Then
        If Target.Value < 100 Then
            ActiveSheet.Shapes("Oval 1").Fill.ForeColor.RGB = vbRed
        ElseIf Target.Value >= 100 And Target.Value < 200 Then
            ActiveSheet.Shapes("Oval 1").Fill.ForeColor.RGB = vbYellow
        Else
            ActiveSheet.Shapes("Oval 1").Fill.ForeColor.RGB = vbGreen
        End If
    End If
End Sub

doc Form ändern Farbe 2

2. Wenn Sie dann den Wert in Zelle A1 eingeben, wird die Formfarbe mit dem von Ihnen definierten Zellenwert geändert.

Note: Im obigen Code, A1 ist der Zellenwert, auf dessen Grundlage Ihre Formfarbe geändert wird, und der Oval 1 Ist der Formname Ihrer eingefügten Form, können Sie sie nach Bedarf ändern.

Beste Office-Produktivitätstools

🤖 Kutools KI-Assistent: Revolutionieren Sie die Datenanalyse basierend auf: Intelligente Ausführung   |  Code generieren  |  Erstellen Sie benutzerdefinierte Formeln  |  Analysieren Sie Daten und erstellen Sie Diagramme  |  Rufen Sie Kutools-Funktionen auf...
Beliebte Funktionen: Suchen, markieren oder identifizieren Sie Duplikate   |  Leere Zeilen löschen   |  Kombinieren Sie Spalten oder Zellen, ohne Daten zu verlieren   |   Runde ohne Formel ...
Super-Lookup: VLookup mit mehreren Kriterien    VLookup mit mehreren Werten  |   VLookup über mehrere Blätter hinweg   |   Unscharfe Suche ....
Erweiterte Dropdown-Liste: Erstellen Sie schnell eine Dropdown-Liste   |  Abhängige Dropdown-Liste   |  Mehrfachauswahl Dropdown-Liste ....
Spaltenmanager: Fügen Sie eine bestimmte Anzahl von Spalten hinzu  |  Spalten verschieben  |  Schalten Sie den Sichtbarkeitsstatus ausgeblendeter Spalten um  |  Vergleichen Sie Bereiche und Spalten ...
Ausgewählte Funktionen: Rasterfokus   |  Designansicht   |   Große Formelleiste    Arbeitsmappen- und Blattmanager   |  Ressourcen (Autotext)   |  Datumsauswahl   |  Arbeitsblätter kombinieren   |  Zellen verschlüsseln/entschlüsseln    Senden Sie E-Mails nach Liste   |  Superfilter   |   Spezialfilter (Filter fett/kursiv/durchgestrichen...) ...
Top 15 Toolsets12 Text Tools (Text hinzufügen, Zeichen entfernen, ...)   |   50+ Chart Typen (Gantt-Diagramm, ...)   |   40+ Praktisch Formeln (Berechnen Sie das Alter basierend auf dem Geburtstag, ...)   |   19 Einfügen Tools (QR-Code einfügen, Bild aus Pfad einfügen, ...)   |   12 Umwandlung (Conversion) Tools (Zahlen zu Wörtern, Currency Conversion, ...)   |   7 Zusammenführen & Teilen Tools (Erweiterte Zeilen kombinieren, Zellen teilen, ...)   |   ... und mehr

Verbessern Sie Ihre Excel-Kenntnisse mit Kutools für Excel und erleben Sie Effizienz wie nie zuvor. Kutools für Excel bietet über 300 erweiterte Funktionen, um die Produktivität zu steigern und Zeit zu sparen.  Klicken Sie hier, um die Funktion zu erhalten, die Sie am meisten benötigen ...

Beschreibung


Office Tab Bringt die Oberfläche mit Registerkarten in Office und erleichtert Ihnen die Arbeit erheblich

  • Aktivieren Sie das Bearbeiten und Lesen von Registerkarten in Word, Excel und PowerPoint, Publisher, Access, Visio und Project.
  • Öffnen und erstellen Sie mehrere Dokumente in neuen Registerkarten desselben Fensters und nicht in neuen Fenstern.
  • Steigert Ihre Produktivität um 50 % und reduziert jeden Tag Hunderte von Mausklicks für Sie!
Comments (22)
Rated 4 out of 5 · 1 ratings
This comment was minimized by the moderator on the site
how would be the VBA code to paint several autoforms according to a range of data?
the values are in column B and I have 20 autoforms.
This comment was minimized by the moderator on the site
Como faço para para variar as cores da forma se minha opções for em formato de texto, como "Sim" e "Não"?
This comment was minimized by the moderator on the site
Hello, Emilly
To solve your problem, please apply the below code:
Private Sub Worksheet_Change(ByVal Target As Range)
If Range("A1") = "Yes" Then
ActiveSheet.Shapes("Oval 1").Fill.ForeColor.RGB = vbRed
Else
If Range("A1") = "No" Then
ActiveSheet.Shapes("Oval 1").Fill.ForeColor.RGB = vbGreen
End If
End If
End Sub


Please have a try, hope it can help you!
This comment was minimized by the moderator on the site
Hi Skyyang,

I tried the original VBA code and got it to work, although it would not activate actively when the cell changed. Today the code is not working and I also tried your more simplistic code and still did not work. The only thing that changed is that I copied the worksheet which contained the code that worked. Would this then result in it not working?
This comment was minimized by the moderator on the site
Hola, excelente ejemplo.
Pero como seria si tengo una forma y quiero ir coloreado poco a poco dependiendo del valor ejemplo:
Si el valor es 50%
Seia mitad roja y mitad verde
Pero que se vaya llenando según el porcentaje vaya aumentando
Rated 4 out of 5
This comment was minimized by the moderator on the site
I am new to VBAs and am struggling with something. I need to have 9 different cells A1-A9 change the colour of 9 different objects. Objects are cubes 1-9. Just to clarify, each cell is to change just one object A1-Cube 1, etc. Red if it fails to meet the value and green if it exceeds the value. The pass/fail value can change so instead of having the value in the VBA I need it to reference cell A10 which has the pass/fail value. Any chance someone could through out a sample code for me to work with.

Thanks
This comment was minimized by the moderator on the site
Great solution! How can I do if I have more than 1 oval in the worksheet which the colors change according to the value input say in A1, B1,C1? Thanks in advance for your reply! 
This comment was minimized by the moderator on the site
Hello mnsosa,Glad to help. Please copy and paste the below VBA code into the blank Module window.
Sub TestMacro2()
Dim dblHt As Double
Dim rngC As Range
Dim lngr As Long
Dim dblMargin As Double
Dim lngSR As Long

lngSR = 2 'Row where the data starts

dblMargin = 6 ' Distance between shapes

'On Error Resume Next
ActiveSheet.Shapes.SelectAll
Selection.Delete
On Error GoTo 0


dblHt = Rows(lngSR).Height * 4

For lngr = lngSR To Cells(lngSR, "A").End(xlDown).Row
ActiveSheet.Shapes.AddShape(msoShapeOval, _
Cells(lngSR, "D").Left + ((lngr - lngSR) Mod 4) * dblHt + dblMargin, _
Cells(lngSR, "D").Top + Int((lngr - lngSR) / 4) * dblHt + dblMargin, _
dblHt - 2 * dblMargin, _
dblHt - 2 * dblMargin).Select
Selection.Name = "Round" & Cells(lngr, "A").Address
Selection.ShapeRange.TextFrame2.VerticalAnchor = msoAnchorMiddle
Selection.ShapeRange(1).TextFrame2.TextRange.Characters.Text = Cells(lngr, "A").Value
With Selection.ShapeRange(1).TextFrame2.TextRange.Characters(1, 2).ParagraphFormat
.FirstLineIndent = 0
.Alignment = msoAlignCenter
End With
With Selection.ShapeRange(1).TextFrame2.TextRange.Characters(1, 2).Font
.Bold = msoTrue
.Fill.Visible = msoTrue
.Fill.ForeColor.ObjectThemeColor = msoThemeColorText1
.Fill.ForeColor.TintAndShade = 0
.Fill.ForeColor.Brightness = 0
.Fill.Transparency = 0
.Fill.Solid
.Size = 12
End With
With Selection.ShapeRange.Fill
.Visible = msoTrue
If Cells(lngr, "A").Value > 70 Then
.ForeColor.RGB = RGB(0, 176, 80)
ElseIf Cells(lngr, "A").Value >= 40 Then
.ForeColor.RGB = RGB(255, 255, 70)
Else
.ForeColor.RGB = RGB(255, 0, 0)
End If
.Transparency = 0
.Solid
End With
Next lngr
Range("A1").Select
End Sub

After you run the VBA code above, you will see multiple shapes are generated, and the colors of these shapes are changed according to the VBA.Please see my screenshot. Hope it can help. Have a nice day.Sincerely,Mandy
This comment was minimized by the moderator on the site
¿Cómo hacemos si tenemos más de 1 Oval en la hoja de trabajo cuyos colores cambian de acuerdo con el valor ingresado, por ejemplo, en A1, B1, C1...? Mil gracias por su ayuda!

This comment was minimized by the moderator on the site
Hello María Noel,
Glad to help. Please copy and paste the below VBA code into the blank Module window.

Sub TestMacro2()
Dim dblHt As Double
Dim rngC As Range
Dim lngr As Long
Dim dblMargin As Double
Dim lngSR As Long

lngSR = 2 'Row where the data starts

dblMargin = 6 ' Distance between shapes

'On Error Resume Next
ActiveSheet.Shapes.SelectAll
Selection.Delete
On Error GoTo 0


dblHt = Rows(lngSR).Height * 4

For lngr = lngSR To Cells(lngSR, "A").End(xlDown).Row
ActiveSheet.Shapes.AddShape(msoShapeOval, _
Cells(lngSR, "D").Left + ((lngr - lngSR) Mod 4) * dblHt + dblMargin, _
Cells(lngSR, "D").Top + Int((lngr - lngSR) / 4) * dblHt + dblMargin, _
dblHt - 2 * dblMargin, _
dblHt - 2 * dblMargin).Select
Selection.Name = "Round" & Cells(lngr, "A").Address
Selection.ShapeRange.TextFrame2.VerticalAnchor = msoAnchorMiddle
Selection.ShapeRange(1).TextFrame2.TextRange.Characters.Text = Cells(lngr, "A").Value
With Selection.ShapeRange(1).TextFrame2.TextRange.Characters(1, 2).ParagraphFormat
.FirstLineIndent = 0
.Alignment = msoAlignCenter
End With
With Selection.ShapeRange(1).TextFrame2.TextRange.Characters(1, 2).Font
.Bold = msoTrue
.Fill.Visible = msoTrue
.Fill.ForeColor.ObjectThemeColor = msoThemeColorText1
.Fill.ForeColor.TintAndShade = 0
.Fill.ForeColor.Brightness = 0
.Fill.Transparency = 0
.Fill.Solid
.Size = 12
End With
With Selection.ShapeRange.Fill
.Visible = msoTrue
If Cells(lngr, "A").Value > 70 Then
.ForeColor.RGB = RGB(0, 176, 80)
ElseIf Cells(lngr, "A").Value >= 40 Then
.ForeColor.RGB = RGB(255, 255, 70)
Else
.ForeColor.RGB = RGB(255, 0, 0)
End If
.Transparency = 0
.Solid
End With
Next lngr
Range("A1").Select
End Sub

After you run the VBA code above, you will see multiple shapes are generated, and the colors of these shapes are changed according to the VBA.
Please see my screenshot. Hope it can help. Have a nice day.
Sincerely,
Mandy
This comment was minimized by the moderator on the site
Hi... excellent solution... but how do I apply it to multiple shapes based on the corresponding values of a range of cells. Many thanks in advance for your help.
This comment was minimized by the moderator on the site
Hello Ryan,
Glad to help. Please copy and paste the below VBA code into the blank Module window.

Sub TestMacro2()
Dim dblHt As Double
Dim rngC As Range
Dim lngr As Long
Dim dblMargin As Double
Dim lngSR As Long

lngSR = 2 'Row where the data starts

dblMargin = 6 ' Distance between shapes

'On Error Resume Next
ActiveSheet.Shapes.SelectAll
Selection.Delete
On Error GoTo 0


dblHt = Rows(lngSR).Height * 4

For lngr = lngSR To Cells(lngSR, "A").End(xlDown).Row
ActiveSheet.Shapes.AddShape(msoShapeOval, _
Cells(lngSR, "D").Left + ((lngr - lngSR) Mod 4) * dblHt + dblMargin, _
Cells(lngSR, "D").Top + Int((lngr - lngSR) / 4) * dblHt + dblMargin, _
dblHt - 2 * dblMargin, _
dblHt - 2 * dblMargin).Select
Selection.Name = "Round" & Cells(lngr, "A").Address
Selection.ShapeRange.TextFrame2.VerticalAnchor = msoAnchorMiddle
Selection.ShapeRange(1).TextFrame2.TextRange.Characters.Text = Cells(lngr, "A").Value
With Selection.ShapeRange(1).TextFrame2.TextRange.Characters(1, 2).ParagraphFormat
.FirstLineIndent = 0
.Alignment = msoAlignCenter
End With
With Selection.ShapeRange(1).TextFrame2.TextRange.Characters(1, 2).Font
.Bold = msoTrue
.Fill.Visible = msoTrue
.Fill.ForeColor.ObjectThemeColor = msoThemeColorText1
.Fill.ForeColor.TintAndShade = 0
.Fill.ForeColor.Brightness = 0
.Fill.Transparency = 0
.Fill.Solid
.Size = 12
End With
With Selection.ShapeRange.Fill
.Visible = msoTrue
If Cells(lngr, "A").Value > 70 Then
.ForeColor.RGB = RGB(0, 176, 80)
ElseIf Cells(lngr, "A").Value >= 40 Then
.ForeColor.RGB = RGB(255, 255, 70)
Else
.ForeColor.RGB = RGB(255, 0, 0)
End If
.Transparency = 0
.Solid
End With
Next lngr
Range("A1").Select
End Sub

After you run the VBA code above, you will see multiple shapes are generated, and the colors of these shapes are changed according to the VBA.
Please see my screenshot. Hope it can help. Have a nice day.
Sincerely,
Mandy
This comment was minimized by the moderator on the site
How do I make the private sub to read the result from the AVERAGE(C1,C5,C9) calculation?

Sub only works with numeric values; any thoughts and suggestions are greatly appreciated.
This comment was minimized by the moderator on the site
Hello Cesare,How are you? I notice that the VBA code can work with the AVERAGE(number, number...) calculation. But the trick is that every time you change the values in the calculation, you need to double-click the formula in the cell to make the VBA work again. 
For example, In cell A1, after we input the formula is =AVERAGE(C2:D3), the VBA works and changes the color of the shape accordingly. Please see screenshot 1. <span style="letter-spacing: 0.2px; color: inherit; font-family: inherit; font-style: inherit; font-variant-ligatures: inherit; font-variant-caps: inherit; font-weight: inherit;">C2:D3, the returned result in cell A1 changes, but the shape color hasn't been changed yet. In this case, we need to double click the formula in cell A1 to make the VBA work. Then the shape color will be changed accordingly. Please see screenshots 2 and 3.</span>
This comment was minimized by the moderator on the site
Thanks for this which is really useful.

I now want to use it with a pivot table on another worksheet which controls the data on the sheet with the shapes that I want to change colour. However, when I change the selection on the pivot table the data on the worksheet with the shapes is updated but the code does not run so the shapes do not change colour

If I manually change the values the code runs and the colour of the shapes is updated.

Question: what do i need to add to the code above to allow it to run automatically?
This comment was minimized by the moderator on the site
How can this be applied if you have multiple shape in the same worksheet?
This comment was minimized by the moderator on the site
Hello Yasir,
Glad to help. Please copy and paste the below VBA code into the blank Module window.

Sub TestMacro2()
Dim dblHt As Double
Dim rngC As Range
Dim lngr As Long
Dim dblMargin As Double
Dim lngSR As Long

lngSR = 2 'Row where the data starts

dblMargin = 6 ' Distance between shapes

'On Error Resume Next
ActiveSheet.Shapes.SelectAll
Selection.Delete
On Error GoTo 0


dblHt = Rows(lngSR).Height * 4

For lngr = lngSR To Cells(lngSR, "A").End(xlDown).Row
ActiveSheet.Shapes.AddShape(msoShapeOval, _
Cells(lngSR, "D").Left + ((lngr - lngSR) Mod 4) * dblHt + dblMargin, _
Cells(lngSR, "D").Top + Int((lngr - lngSR) / 4) * dblHt + dblMargin, _
dblHt - 2 * dblMargin, _
dblHt - 2 * dblMargin).Select
Selection.Name = "Round" & Cells(lngr, "A").Address
Selection.ShapeRange.TextFrame2.VerticalAnchor = msoAnchorMiddle
Selection.ShapeRange(1).TextFrame2.TextRange.Characters.Text = Cells(lngr, "A").Value
With Selection.ShapeRange(1).TextFrame2.TextRange.Characters(1, 2).ParagraphFormat
.FirstLineIndent = 0
.Alignment = msoAlignCenter
End With
With Selection.ShapeRange(1).TextFrame2.TextRange.Characters(1, 2).Font
.Bold = msoTrue
.Fill.Visible = msoTrue
.Fill.ForeColor.ObjectThemeColor = msoThemeColorText1
.Fill.ForeColor.TintAndShade = 0
.Fill.ForeColor.Brightness = 0
.Fill.Transparency = 0
.Fill.Solid
.Size = 12
End With
With Selection.ShapeRange.Fill
.Visible = msoTrue
If Cells(lngr, "A").Value > 70 Then
.ForeColor.RGB = RGB(0, 176, 80)
ElseIf Cells(lngr, "A").Value >= 40 Then
.ForeColor.RGB = RGB(255, 255, 70)
Else
.ForeColor.RGB = RGB(255, 0, 0)
End If
.Transparency = 0
.Solid
End With
Next lngr
Range("A1").Select
End Sub

After you run the VBA code above, you will see multiple shapes are generated, and the colors of these shapes are changed according to the VBA.
Please see my screenshot. Hope it can help. Have a nice day.
Sincerely,
Mandy
There are no comments posted here yet
Load More
Please leave your comments in English
Posting as Guest
×
Rate this post:
0   Characters
Suggested Locations