Direkt zum Inhalt

Wie kann ich einen Wert nachschlagen und die Zelle oben oder unten in Excel zurückgeben?

In Excel verwenden wir die VLOOKUP-Funktion, um einen bestimmten Wert aus Bereichsdaten zu ermitteln. Wissen Sie jedoch, wie Sie einen Wert nachschlagen und dann seine über- oder untergeordneten Werte zurückgeben können? Tatsächlich können Sie die INDEX-Funktion verwenden, um damit umzugehen.

Suchen Sie einen Wert und geben Sie die Zelle oben oder unten zurück


Pfeil blau rechte Blase Suchen Sie einen Wert und geben Sie die Zelle oben oder unten zurück

Suchen Sie einen Wert und geben Sie die Zelle oben zurück

Wählen Sie eine leere Zelle aus, in der Sie den Rückgabewert platzieren möchten, und geben Sie diese Formel ein =INDEX(A1:A8,MATCH(D1,A1:A8,0)-1,1), Drücken Sie Enter Taste, um den Wert zurückzugeben. Siehe Screenshot:
doc look return cell über 1

Suchen Sie einen Wert und geben Sie die Zelle unten zurück

Wählen Sie eine leere Zelle aus, in der Sie den Rückgabewert platzieren möchten, und geben Sie diese Formel ein =INDEX(A1:A8,MATCH(D1,A1:A8,0)+1,1), Drücken Sie Enter Schlüssel, um das Ergebnis zu erhalten. Siehe Screenshot:
doc look return cell über 2

Note: In den Formeln ist das erste A1: A8 der Bereich, in dem Sie nach dem Wert suchen, und das zweite A1: A8 ist der Bereich, in dem Sie nach dem Kriterium suchen möchten. D1 ist der Wert, den Sie suchen Spaltennummer, die Sie zurückgeben möchten.

Wenn Sie nach einem Wert suchen und unten und die 3 Zellen rechts von der Referenz zurückkehren möchten, können Sie diese Formel anwenden =INDEX(F1:H8,MATCH(K1,F1:F8,0)+1,3).
doc look return cell über 3

Tip.Wenn Sie schnell nach einem Wert suchen und in eine andere Spalte zurückkehren möchten, versuchen Sie bitte, die Kutools für Excel zu verwenden Suchen Sie nach einem Wert in der Liste wie im folgenden Screenshot gezeigt. Es ist voll funktionsfähig ohne Einschränkung in 60 Tagen, Bitte laden Sie es herunter und testen Sie es jetzt kostenlos.
doc look return cell über 4

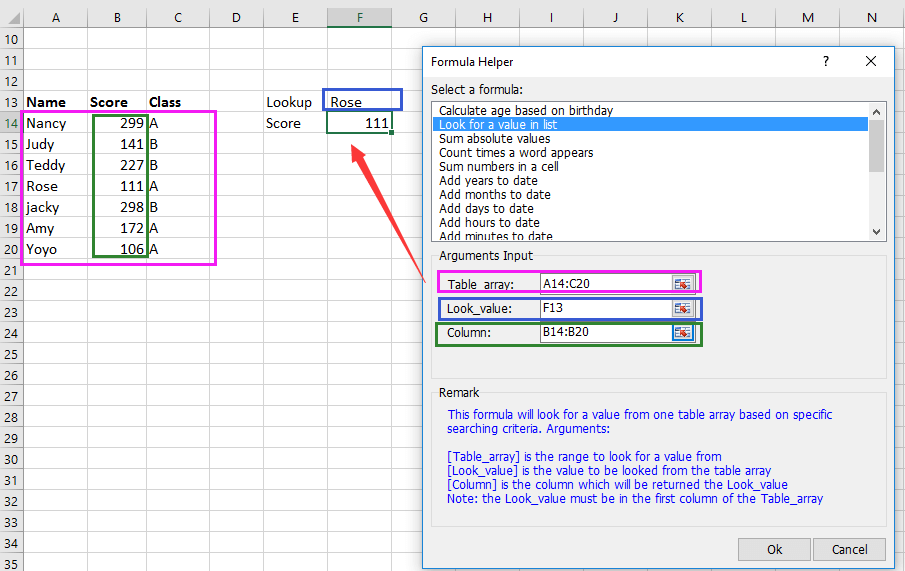
Beste Office-Produktivitätstools

🤖 Kutools KI-Assistent: Revolutionieren Sie die Datenanalyse basierend auf: Intelligente Ausführung   |  Code generieren  |  Erstellen Sie benutzerdefinierte Formeln  |  Analysieren Sie Daten und erstellen Sie Diagramme  |  Rufen Sie Kutools-Funktionen auf...
Beliebte Funktionen: Suchen, markieren oder identifizieren Sie Duplikate   |  Leere Zeilen löschen   |  Kombinieren Sie Spalten oder Zellen, ohne Daten zu verlieren   |   Runde ohne Formel ...
Super-Lookup: VLookup mit mehreren Kriterien    VLookup mit mehreren Werten  |   VLookup über mehrere Blätter hinweg   |   Unscharfe Suche ....
Erweiterte Dropdown-Liste: Erstellen Sie schnell eine Dropdown-Liste   |  Abhängige Dropdown-Liste   |  Mehrfachauswahl Dropdown-Liste ....
Spaltenmanager: Fügen Sie eine bestimmte Anzahl von Spalten hinzu  |  Spalten verschieben  |  Schalten Sie den Sichtbarkeitsstatus ausgeblendeter Spalten um  |  Vergleichen Sie Bereiche und Spalten ...
Ausgewählte Funktionen: Rasterfokus   |  Designansicht   |   Große Formelleiste    Arbeitsmappen- und Blattmanager   |  Ressourcen (Autotext)   |  Datumsauswahl   |  Arbeitsblätter kombinieren   |  Zellen verschlüsseln/entschlüsseln    Senden Sie E-Mails nach Liste   |  Superfilter   |   Spezialfilter (Filter fett/kursiv/durchgestrichen...) ...
Top 15 Toolsets12 Text Tools (Text hinzufügen, Zeichen entfernen, ...)   |   50+ Chart Typen (Gantt-Diagramm, ...)   |   40+ Praktisch Formeln (Berechnen Sie das Alter basierend auf dem Geburtstag, ...)   |   19 Einfügen Tools (QR-Code einfügen, Bild aus Pfad einfügen, ...)   |   12 Umwandlung (Conversion) Tools (Zahlen zu Wörtern, Currency Conversion, ...)   |   7 Zusammenführen & Teilen Tools (Erweiterte Zeilen kombinieren, Zellen teilen, ...)   |   ... und mehr

Verbessern Sie Ihre Excel-Kenntnisse mit Kutools für Excel und erleben Sie Effizienz wie nie zuvor. Kutools für Excel bietet über 300 erweiterte Funktionen, um die Produktivität zu steigern und Zeit zu sparen.  Klicken Sie hier, um die Funktion zu erhalten, die Sie am meisten benötigen ...

Beschreibung


Office Tab Bringt die Oberfläche mit Registerkarten in Office und erleichtert Ihnen die Arbeit erheblich

  • Aktivieren Sie das Bearbeiten und Lesen von Registerkarten in Word, Excel und PowerPoint, Publisher, Access, Visio und Project.
  • Öffnen und erstellen Sie mehrere Dokumente in neuen Registerkarten desselben Fensters und nicht in neuen Fenstern.
  • Steigert Ihre Produktivität um 50 % und reduziert jeden Tag Hunderte von Mausklicks für Sie!
Comments (34)
No ratings yet. Be the first to rate!
This comment was minimized by the moderator on the site
Hi, I need help with this excel formula. I want to the display largest values with their corresponding names, i have 3 names with the same name value but my formula returns only 1 name for all the 3 values. =INDEX(Client,MATCH(L6,Month,0)).
This comment was minimized by the moderator on the site
Hi there... what formula can I use to say .. if the sum of a formula in a cell is greater than a number then return the amount greater than 48 in the cell below?
This comment was minimized by the moderator on the site
Hi, Cindy, I do not know how your data display. Here I have a formula =INDEX(G1:G6,MATCH(IF(I1>100,MIN(IF(G1:G6>K1,G1:G6))),G1:G6,0)+1,1) which use for this example:
In G1:G6, it lists some products and prices, in I1 is the sum of a formula, in K1 type 48 into it. Then suppose that if the sum is greater than 100, it will show the cell contents below the value that greater than 48 of list G1:G6. See screenshot:
https://www.extendoffice.com/images/stories/comments/sun-comment/doc-formula-2.png
If you just want to return the number which is greater than 48 when the sum is greater than 100, use formula =IF(I1>100,MIN(IF(G1:G6>K1,G1:G6)))
This comment was minimized by the moderator on the site
Hi,
Using MS-Excel I want a separate list of numbers from each column which are coming after 22.


22 54 49 94
34 88 18 22
92 48 22 86
22 63 83 31
89 15 76 5
71 89 33 84
86 77 79 22
1 22 88 12
71 68 22 75
7 74 36 59
74 39 98 63
52 66 22 58
22 31 26 0
67 16 60 13
14 33 16 77
37 37 25 1

Pls help.
Thankyou.
This comment was minimized by the moderator on the site
Hi, I do not understand your question. May you describe your quetion with more details, or give me a before and after comparison.
This comment was minimized by the moderator on the site
Hi, I am wanting to pick a state then pick how many kgs and then it references the Price per weight listed as it changes from point to point
0-500 501-1000 1001-5000 50001-1000 10001-2200 22000+
TBRI 0.476 0.282 0.219 0.197 0.177 0.159
TCNS 0.26 0.154 0.114 0.106 0.099 0.085
TGLD 0.246 0.146 0.108 0.097 0.087 0.059
TGOL 0.605 0.485 0.387 0.287 0.213 0.197
TMCK 0.1 0.077 0.006 0.048 0.04 0.029
PPP 0.246 0.146 0.108 0.097 0.087 0.059
TRTN 0.187 0.111 0.082 0.074 0.066 0.055
TTSV 0.187 0.111 0.082 0.074 0.066 0.245
TSYD 0.562 0.376 0.342 0.308 0.277 0.259
TNTL 0.427 0.286 0.26 0.299 0.278 0.259
TWLG 0.834 0.523 0.444 0.399 0.359 0.31
This comment was minimized by the moderator on the site
Hi, i´m having the following issue, i m using the MIN function to retrieve the smallest value of a row but i m not able to retrieve the value of the cell next to the smallest

0,82 € 690 0,92 € 721 0,61 € 2446 0,71 € 2443 114 2212

each of these values are in a cell and what i need is for ex: smallest value is 0.61 so i want to retrieve the cell right next to it 2443. im using Office 2010. thanks a lot
This comment was minimized by the moderator on the site
Hi, Paulo, if all your data is in a row, and each of them in a single cell, you can try this formula: =INDIRECT(CELL("address",INDEX(A1:J1,MATCH(MIN(A1:J1),A1:J1,0)+1))), if your data is in to columns, such as:
0,82 690
0,92 721
0,61,2446
0,71 2443
114 2212
you can visit this tutorial How To VLOOKUP The Lowest Value And Return Adjacent Cell In Excel?, it will hel you.
This comment was minimized by the moderator on the site
I can only get this formula to perform by putting the MATCH clause in additional parentheses so as to carry out the arithmetic function. Otherwise it returns a #VALUE error.

Original: =INDEX(A1:A8,MATCH(D1,A1:A8,0)-1,1)
Corrected: =INDEX(A1:A8,(MATCH(D1,A1:A8,0))-1,1)
This comment was minimized by the moderator on the site
I'm trying to figure out a way to bring a customer number (text field) by looking up the invoice number. See below. I want to go to another sheet and if cell equals 6491 then return customer number 007517 (text field), and if cell equals 6487 return 009897

6491 007517
6491 007517
6486 007517
6481 009897
6487 009897
6481 009897
6480 009897

Any help would be appreciated.

Thank you!!
This comment was minimized by the moderator on the site
Hi, Brad Grimes, Excel VLOOKUP function can help you to quickly solve the job. Pleae visit this tutorial LOOKUP Values from Another Worksheet or Workbook, it provides examples to explain how to use the VLOOOKUP function.
This comment was minimized by the moderator on the site
Anyone able to answer John Chapman's question from four years ago? I have similar challenge. My current formula is =COUNTIFS(G2:G16482,"<2",I2:I16482,F16490)
but I want to count the occurence of the value in cell F16490 in the row above for the range I2:I16482.
This comment was minimized by the moderator on the site
Hello, This is useful for the row above or below but I would like to alternate the lookup sometimes +1 to +3 or - 1 to -3. Can I make one formula that uses an input cell reference so I can type in an offset?
This comment was minimized by the moderator on the site
I have multiple rows with "Name" in the row just above the cell with a person's name in it. The formula works great for just one name but I have a few thousand names. How do I convert the formula so it will find each name and bring them into a separate column?
There are no comments posted here yet
Load More
Please leave your comments in English
Posting as Guest
×
Rate this post:
0   Characters
Suggested Locations